The Marketing Analytics Brain, Part 2: Smarter Editorial Decisions with Data
M.N. · 8 min read · 20/05/2026
Part 2 of 4 — Part 1: Getting the Data to Trust Itself · Part 3: Paid and Organic Intelligence in One View · Part 4: AI Search, Human Judgment, and What This Tool Is Actually For
This is the second in a four-part series describing a marketing analytics tool built to replace scattered dashboards with a single system designed around decisions. Part 1 covered the data foundation: normalizing sources, detecting anomalies, and mapping search performance geographically. This article covers the editorial and content layer.
Scoring Editorial Work
An editorial team with a large content library faces a prioritization problem that has no obvious solution. Every post could theoretically be refreshed. Most do not need it yet. A few are quietly declining and genuinely need attention. The question is which ones, and in what order.
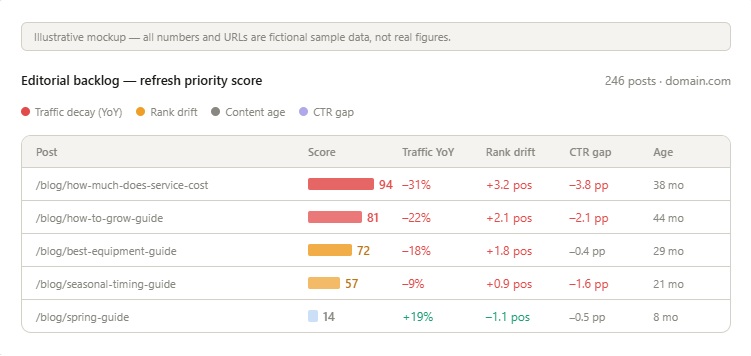
The approach is to build a composite score from signals that each independently suggest a refresh need, then let convergence between signals drive the ranking. Four signals feed into the score:
Traffic decay measures whether a post is sending less search traffic this year than last year. This is the primary outcome signal, the thing a refresh is ultimately trying to reverse.
Rank drift is the leading indicator. A post whose average position is gradually worsening has not lost much traffic yet, but it will. Getting there before the traffic drops is worth more than reacting after.
Content age reflects the fact that information gets stale. A post from three years ago discussing pricing, tools, or best practices is likely factually outdated even if Google has not penalized it yet. Age alone is not enough reason to act, but age combined with any of the other signals moves the post up the queue.
CTR gap identifies a specific and cheap intervention. If a post ranks well and gets impressions but users are not clicking, the problem is the title or meta description rather than the content. Fixing that takes an hour and can double organic traffic to the page without touching the article itself.
A post that triggers all four signals is the clearest case. One that is aging but still growing traffic and improving in position scores near zero. It does not need attention yet.
Three Lenses for Content Opportunity
Beyond refresh prioritization, there is the separate question of what new content to commission or what existing content to improve. Three lenses frame this, each with a different effort-to-impact ratio.
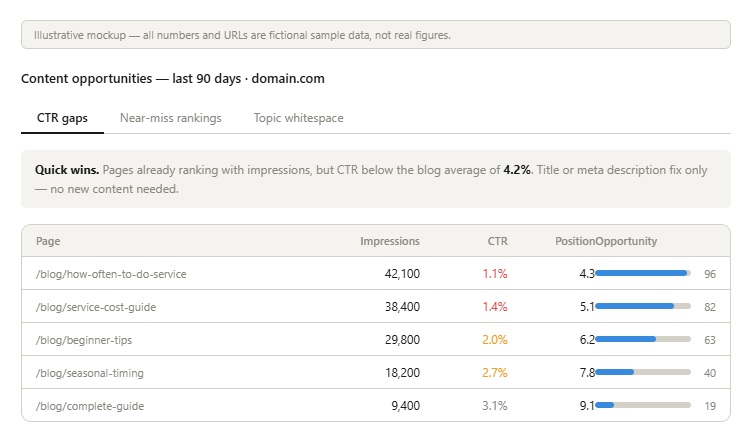
The first lens finds quick wins. These are pages that already rank and receive impressions but where users are not clicking at the rate they should be. The pages have authority. They just have a copy problem. Improving the title tag or meta description requires no new content and no link building. The opportunity gets scored by multiplying the CTR gap by impression volume, which puts high-traffic pages with large gaps above low-traffic pages with the same percentage gap.
The second lens targets pages sitting at positions eleven through twenty. The click distribution in organic search is nonlinear. Position one receives a large multiple of what position eleven receives, and the jump from page two to page one is worth more than any improvement within page one. Pages in this range are the best candidates for internal linking or targeted content work because they already have some authority. They just need a push.
The third lens finds genuine content gaps: search queries where the site ranks but the page doing the ranking is the wrong type. A service query landing on a blog post, or an informational query ranking on a city page, signals that no dedicated article exists for that topic. The pages covering it are doing their best but they are not built for it. These queries are the most valuable editorial calendar inputs because the demand is already proven and there is no existing page to compete with.
Testing Titles and Meta Descriptions at Scale
Changing a title tag on one page and watching what happens is not a test. There are too many confounding variables and too much week-to-week noise at the page level. The A/B testing framework here scales that up by running changes across groups of pages simultaneously. Test pages get the new treatment, control pages keep the original.
Aggregating across dozens of pages on each side reduces the noise enough to see whether a systematic title change lifted CTR, improved position, or moved click volume. The before and after comparison anchors to the actual implementation date rather than a fixed calendar window, so a test that ran for six weeks gets six weeks of data regardless of when it was configured.
Statistical significance is calculated separately from the organic signal. GSC data tells you whether position and clicks moved in the expected direction. Conversion significance tells you whether the downstream business outcome was real. Both together answer the questions that matter: did the change help rankings and did it help business results.
Part 3 covers paid and organic as a single system: finding budget wasted on terms organic already covers, spotting rising demand before competitors do, and identifying which organic pages make the best paid landing pages.