The Marketing Analytics Brain, Part 4: AI Search, Human Judgment, and What This Tool Is Actually For
M.N. · 10 min read · 09/06/2026
Part 4 of 4 — Part 1: Getting the Data to Trust Itself · Part 2: Smarter Editorial Decisions with Data · Part 3: Paid and Organic Intelligence in One View
This is the final article in a four-part series describing a marketing analytics tool built to replace scattered dashboards with a single system designed around decisions. Part 1 covered data infrastructure. Part 2 covered editorial and content work. Part 3 covered paid and organic intelligence. This article covers the AI search layer, how the tool handles natural language queries, and the honest limits of what any data tool can do on its own.
Measuring AI Search as a Channel
Something shifted measurably during 2024 and continued through 2025: AI assistants became a real source of web traffic, and their behavior is visible in server logs before any of it shows up in analytics.
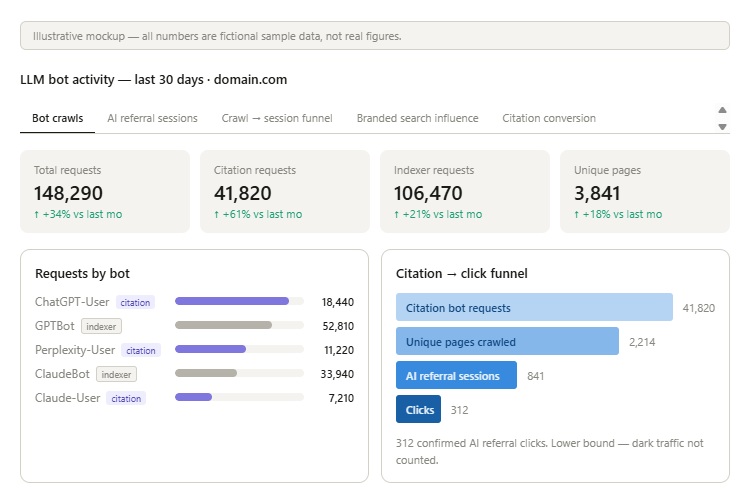
AI bots, unlike human browsers, identify themselves in the user agent string of every request. They do not try to look like ordinary visitors. This means server access logs contain a clean record of every time an AI assistant fetched a page: which URL, which system, and whether it was a live response or a background index crawl.
Citation Bots vs Indexing Bots
The distinction matters practically. A citation bot is an AI assistant actively fetching content to include in a response it is generating right now. A user asked a question, the AI decided the page was relevant, and it is reading the page in real time to formulate an answer. An indexing bot is building or refreshing a knowledge base for future use.
Citation bot activity is the more actionable of the two. It tells you which pages AI assistants are using today. High citation volume on a page means its content is being incorporated into AI-generated answers at scale, which has implications for traffic, brand exposure, and influence that do not appear in standard click metrics.
The Attribution Funnel
Much of the traffic that AI assistants drive is invisible to standard analytics. When an assistant answers a question using your content, some users click through to the site. Those sessions show up with AI platform domains as the referrer. But many users take the answer and move on without clicking. The content influenced them; the traffic never materialized.
The system tracks this across several layers. Raw crawl volume by bot type establishes what is being fetched and when. Referral sessions from AI platform domains show what is converting to actual traffic. A crawl-to-session funnel matches pages that received citation bot requests against pages that later received AI referral sessions. A branded search correlation tests whether citation volume tracks with branded keyword searches over time. A lift analysis compares traffic on days citation bots crawled specific pages against days they did not.
The most defensible number for any reporting conversation is the confirmed click count from events with verified AI platform referrer headers. Everything else is directional evidence for what is happening above that floor.
Treating AI search as a channel with measurable behavior, rather than as something that steals clicks, opens up a different set of questions and a different set of actions.
Natural Language as an Interface
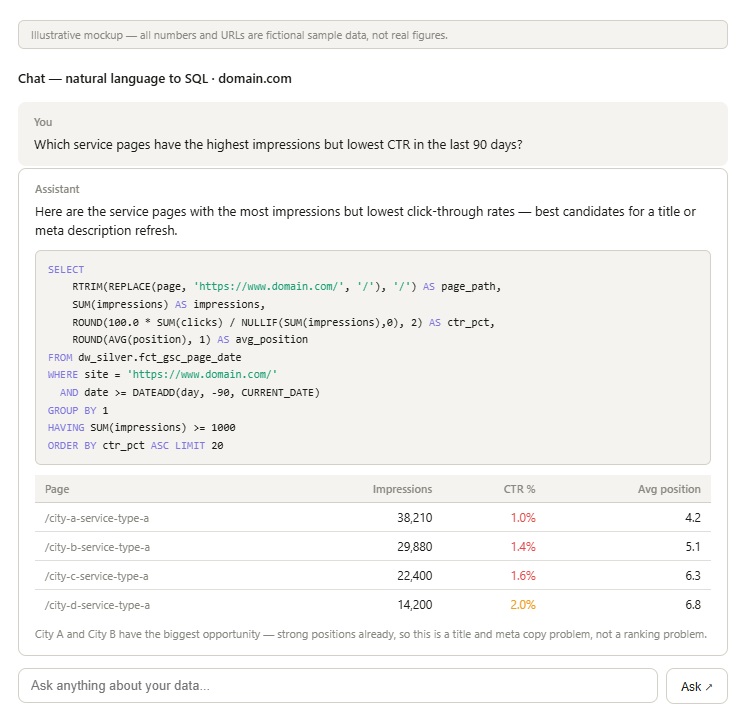
The last layer in this system is the least analytical but probably the most useful day-to-day. A conversational interface lets anyone on the team ask questions about the data in plain English and get answers drawn from the live warehouse.
The model gets a complete description of the available tables, the join keys between them, the brand-specific filter values, and the URL normalization patterns. With that context, it can translate a question like "which pages lost the most clicks this week compared to last week" into correct SQL, run it against the real data, and return both the result and a plain-English explanation of what the query is measuring.
Data access stops being gated by SQL fluency. A content strategist can ask about blog performance on specific topics. A brand manager can ask about paid spend on branded terms. An executive can ask for a weekly summary without waiting for a report to be prepared. The answers come from the same data that all the other views use, with the same normalization and the same segment definitions.
How Long It Actually Took
The tool took about a month to build in its core form, then another two months finding edge cases, fixing things that broke in ways that were hard to anticipate, and recalibrating logic that looked right in theory but produced noise in practice. That second phase is hard to avoid when building something this complex, and it was where most of the real decisions got made.
The technical work was not the hard part. What took time was the logic: when should a drop trigger an alert versus be ignored, how should attribution be counted when the evidence is partial, what weight should each signal carry in a composite score. Every time a new data layer went in, these questions came back up, because each layer had to work coherently with everything already in place.
What This Tool Is Not
This is not an automation tool. It is not meant to trigger changes, update pages, or act on anything without a human in the loop. It is a decision support tool, built for a search specialist who already knows the context and uses the data to think more clearly and move faster.
That distinction matters because the tool will sometimes be wrong in ways that automation would make worse. It can flag a traffic drop as anomalous when the drop was intentional. It can miss seasonal patterns that a specialist would recognize immediately. It can surface an alert about a page where the real explanation is something external that the data alone cannot see.
A drop alert is a prompt to investigate, not a verdict. An editorial refresh score is a starting point for a conversation, not a content brief. The value is not that it replaces human judgment. It is that it means the specialist spends less time finding the signal and more time applying the judgment that only a person can bring.
A System That Grows With the Data
A tool like this is never really finished. Search changes, new data sources become available, and each one is an opportunity to make the decisions the tool supports a little sharper.
A good recent example is the URL-level impression data for AI Overviews and AI Mode that Google recently announced for Search Console. That data slots directly into a system like this and would give a much cleaner picture of which pages are appearing inside AI-generated search results, how often, and whether that visibility is translating into clicks or being absorbed without a clickthrough. Combined with the LLM bot activity data already tracked at the server level, it would close a significant gap in the attribution picture.
As the search landscape changes and new measurement tools emerge, a well-structured system can incorporate them without rebuilding from scratch. The architecture just needs to be designed with that in mind from the start.
If This Sounds Useful to You
If you work in search and recognize the problems described across this series, I am happy to talk through what it would take to build something similar for your setup.
The starting point is always the data: what you have, where it lives, and what gaps need to be filled before the interesting analysis becomes possible. That conversation is different for every organisation depending on the stack, the team structure, and the decisions that actually need to be made.
If you want to understand what data you would need, how to get it into a usable shape, and how a system like this could be structured for your context, reach out. The goal would be to help you get to something genuinely useful, not just another dashboard that sits open in a browser tab and gets checked once a week out of habit.
This is Part 4 of a four-part series. Start from the beginning with Part 1: Getting the Data to Trust Itself.